Election results: 10 charts that show how Britain voted
How many seats did each party win compared to votes? How did this change from 2010? What was the turnout? And how did the regions vote?

Sign up for the View from Westminster email for expert analysis straight to your inbox
Get our free View from Westminster email
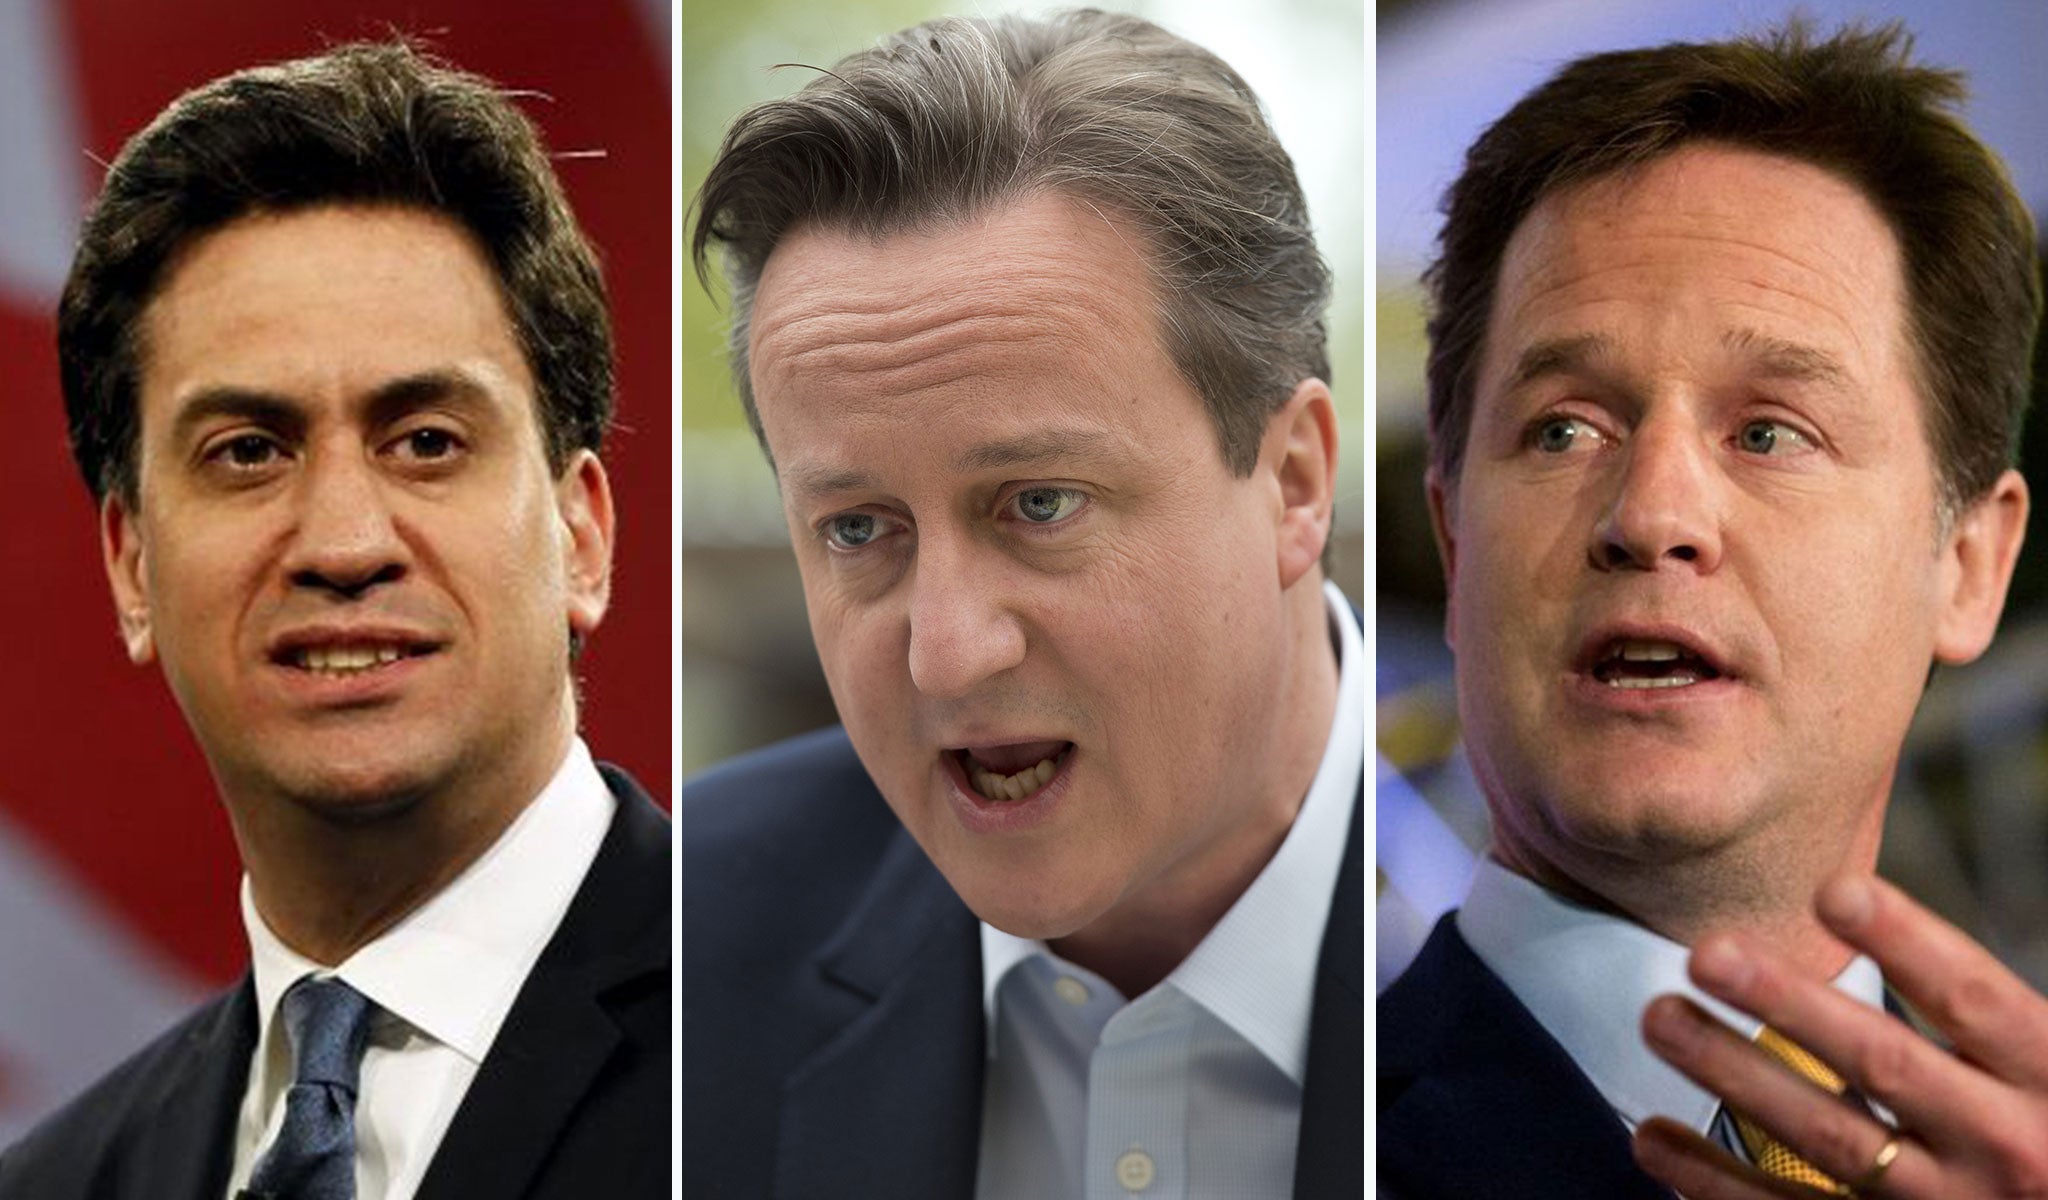
Conservatives won an unexpected majority in an extraordinary night of election results, winning 331 seats and taking them over the all-important threshold to be able to pass laws in the House of Commons.
But this only begins to tell the full story. The SNP surged to victory in Scotland, winning all but three of the 59 seats north of the border, while Ukip picked up just one seat despite winning the third largest share of the vote.
Here is the story of how Britain voted - told through 11 charts
Subscribe to Independent Premium to bookmark this article
Want to bookmark your favourite articles and stories to read or reference later? Start your Independent Premium subscription today.
Join our commenting forum
Join thought-provoking conversations, follow other Independent readers and see their replies